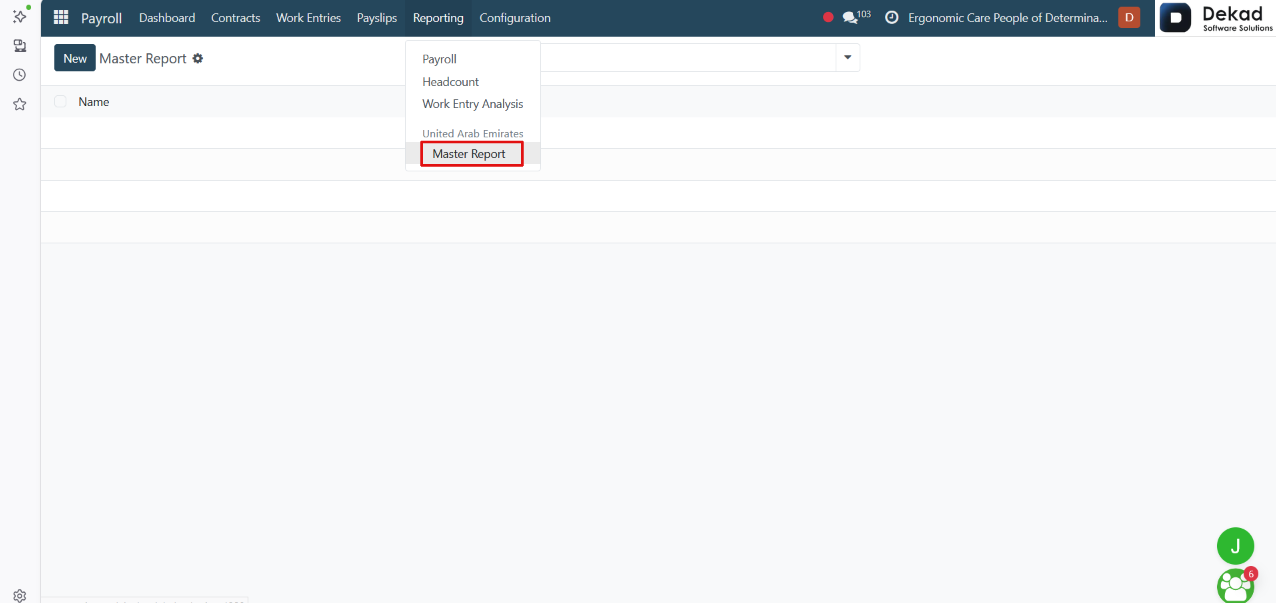
6. Reporting
The Reporting section provides analytical reports
that help users monitor, review, and analyze
payroll data.
It presents payroll information in different report
formats, allowing users to track salary costs,
work entries, payslips, and other payroll-related
metrics. These reports support better decision-making
by providing clear insights into payroll activities
and employee compensation trends.
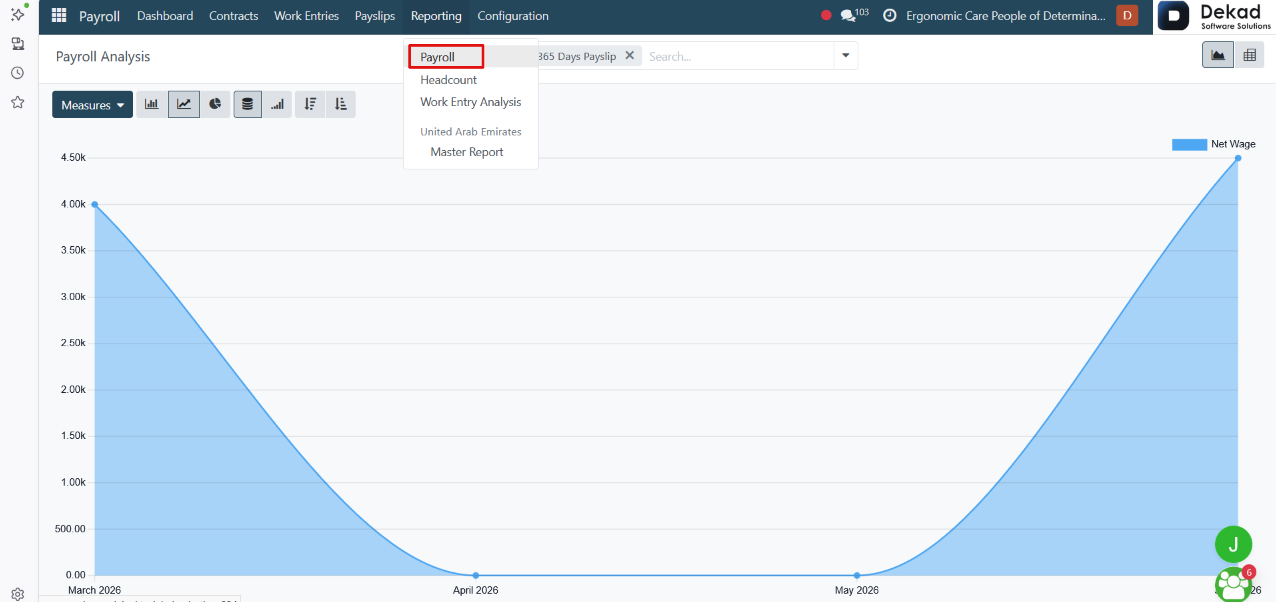
6.1 Payroll
The Payroll provides an analytical overview
of payroll data and employee compensation.
It summarizes payroll information such as payslips,
gross wages, net wages, basic wages, worked hours,
worked days, and other payroll metrics. Users can
analyze payroll data using different views, including
Line, Bar, Pie, and Pivot, and apply filters or
grouping options to gain insights into payroll
trends and costs across the organization.
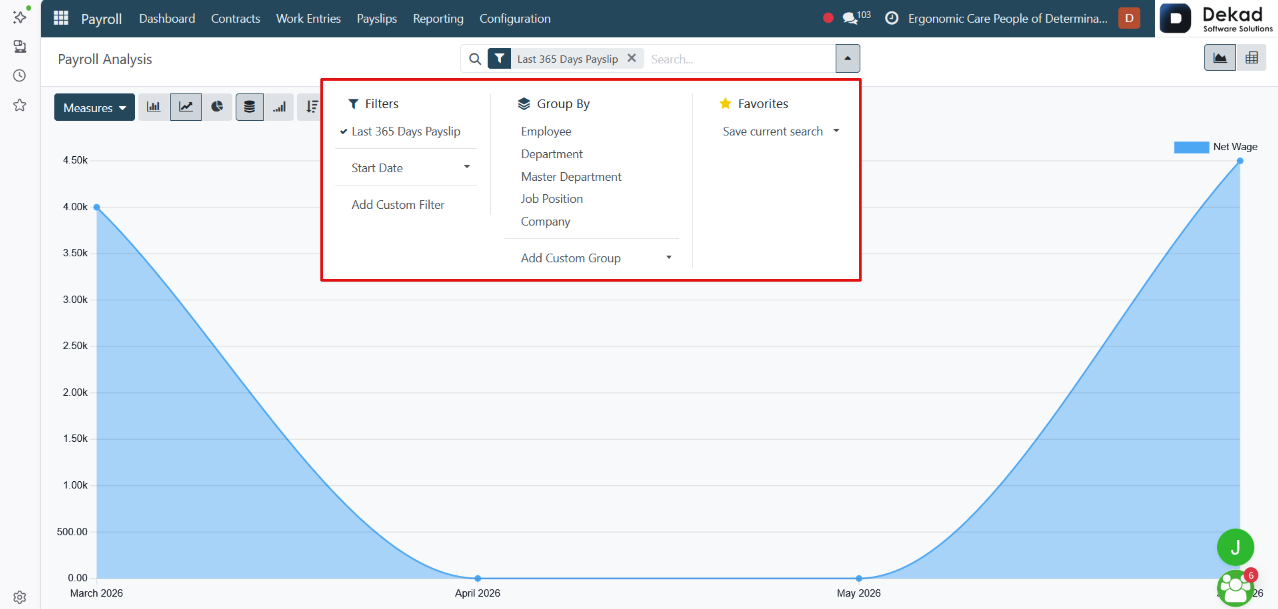
Search and Filtering
The Search and Filtering feature allows users to
quickly locate and analyze specific payroll records.
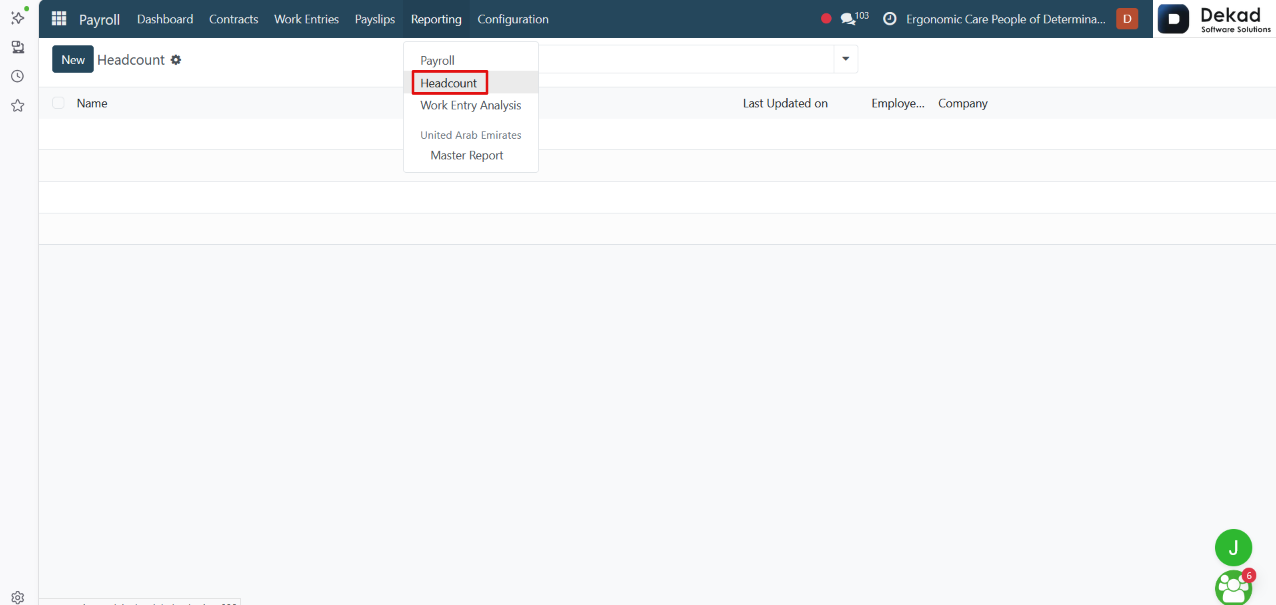
6.2 Headcount
The Headcount report shows the total number of
employees in the company over a selected period.
It helps users track workforce size, monitor hiring
and departures, and analyze employee distribution
over time. The report can be viewed using different
filters and time ranges to understand changes in
employee numbers and support workforce planning
decisions.
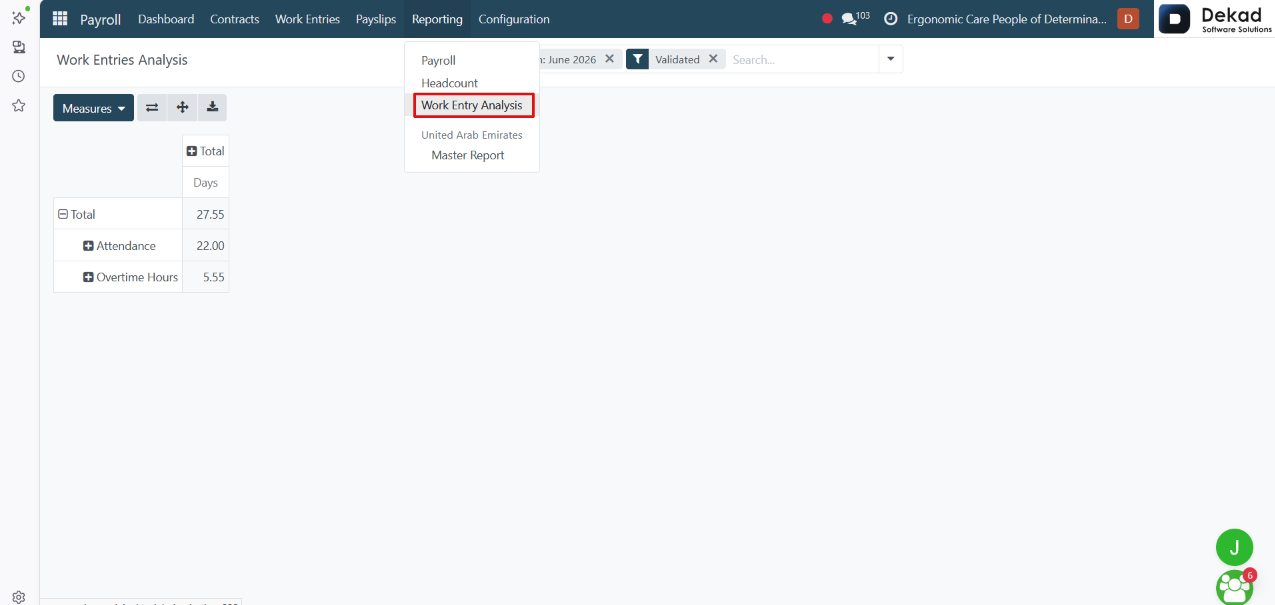
6.3 Work Entry Analysis
The Work Entry Analysis report provides a detailed
overview of employee work entries used for payroll
calculation.
It displays information such as worked days, absences,
overtime, and other work-related records. This helps
users analyze employee attendance patterns, verify
work data accuracy, and ensure correct payroll
processing based on validated work entries. Users
can filter and group data to better understand
workforce activity over time.
6.4 Master Report
The Master Report is the main and highest-level
report in the payroll system.